Note
Go to the end to download the full example code.
MagmaForge: Equilibrium Decompression#
Demonstrates how to run an equilibrium (isentropic) decompression routine using MagmaForge.
Open this code in an executable MyBinder instance (MyBinder links may be slow to load– please be patient!):
Initialization#
Import necessary packages:
import thermoengine
from thermoengine import magmaforge

import numpy as np
import pandas as pd
import matplotlib.pyplot as plt
Define a bulk composition:
DMM  = {
        'SiO2': 44.71,
        'TiO2': 0.130,
        'Al2O3': 3.98,
        'Cr2O3': 0.0,
        'FeO':  8.18,
        'MgO':  38.73,
        'CaO':  3.17,
        'Na2O':  0.13,
        'K2O':  0.006,
        'P2O5':  0.019,
        'MnO': 0.0,
        'CoO': 0.0,
        'NiO': 0.0
        }

P_GPa = 2.5
Fe3_tFe = 0.1
Find the solidus#
Eventually magmaforge will be able to do this automatically
sys = magmaforge.System(comp=DMM,
                        T_C = 1600.0,
                        P_GPa=P_GPa,
                        Fe3_tFe = Fe3_tFe,
                        database='MELTS_pMELTS',
                        )

sys.crystallize(method='equil',
                Tstep=5,
                fix_fO2=False,
                calc_args={'debug':0})

solidus_T = sys.T_C

print(f"Solidus found at {solidus_T :.1f}˚C")
/workspaces/ThermoEngineLite/thermoengine/thermoengine/magmaforge/system.py:782: UserWarning: System is not above the liquidus at starting temperature, which may cause equilibration routines to struggle. Consider using .get_liquidus_temp() method and reinitializing the system.
  warnings.warn("System is not above the liquidus at starting temperature, which may cause equilibration routines to struggle. " \
Solidus found at 1480.0˚C
System and Calculations#
Define the system using magmaforge:
sys = magmaforge.System(comp=DMM,
                        T_C = solidus_T,
                        P_GPa=P_GPa,
                        Fe3_tFe=Fe3_tFe,
                        database='MELTS_pMELTS'
                        )
Decompress system:
sys.melt_by_decompression(P_GPa_final=0.5,
                          method='equil',
                          P_GPa_step=0.1,
                          )
<thermoengine.magmaforge.system.System object at 0xffff8a3f8310>
Output#
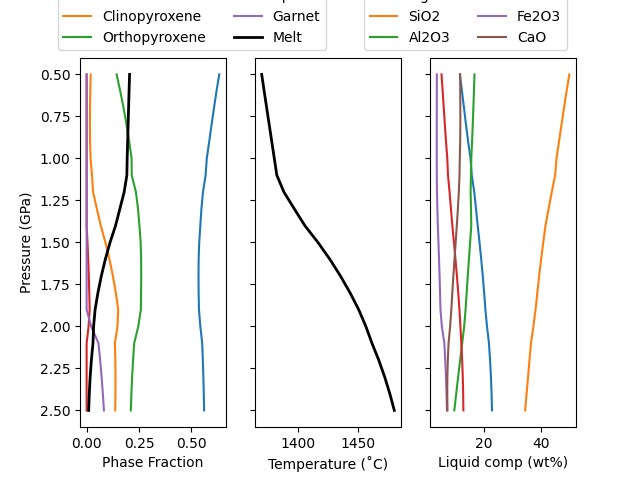
Magma Evolution plot
oxides_to_plot = ['MgO', 'SiO2', 'Al2O3', 'FeO', 'Fe2O3', 'CaO']

phase_fracs = sys.history.get_phase_frac_table(phases='present')
liq_comps = sys.history.get_liquid_comp_table()
pressures = sys.history.get_pressures()
temperatures = sys.history.get_temperatures()

fig, ax = plt.subplots(1, 3, sharey='row')

for ph in phase_fracs.columns:
    if ph != 'Liquid':
        ax[0].plot(phase_fracs[ph], pressures/10000,
                   label=ph)


ax[0].plot(phase_fracs['Liquid'], pressures/10000,
           lw=2, c='k', label='Melt')

ax[1].plot(temperatures - 273.15, pressures/10000, c='k', lw=2)

for ox in oxides_to_plot:
  if liq_comps[ox].iloc[0] > 0:
    ax[2].plot(liq_comps[ox], pressures/10000, label=ox)

ax[0].invert_yaxis()
ax[0].legend(ncol=2, loc='upper left', bbox_to_anchor=(-0.2,1.22))
ax[2].legend(ncol=2, loc='upper left', bbox_to_anchor=(-0.5, 1.22))

ax[0].set_ylabel('Pressure (GPa)')
ax[0].set_xlabel('Phase Fraction')
ax[1].set_xlabel('Temperature (˚C)')
ax[2].set_xlabel('Liquid comp (wt%)')
Text(0.5, 23.52222222222222, 'Liquid comp (wt%)')
Save Output ———–
All of the output can be saved to csv files for future use, for example, uncomment the following:
# phase_fracs.to_csv('MELTS_phase_fracs.csv')
# liq_comps.to_csv('MELTS_liquid_comps.csv')
Total running time of the script: (0 minutes 52.480 seconds)