Note
Go to the end to download the full example code.
MagmaForge: Find Liquidus#
Demonstrates how to find the liquidus for a given bulk composition.

Initialization#
Import necessary packages:
from thermoengine import magmaforge

import pandas as pd
import numpy as np
import matplotlib.pyplot as plt
Choose a database (uncomment the appropriate line)
# rhyolite-MELTS v1.2
db = 'MELTS_v1_2'

# rhyolite-MELTS v1.0
# db = 'MELTS_v1_0'

# pMELTS
# db = 'MELTS_pMELTS'
Define a bulk composition:
# MORB
comp_wtpt = pd.Series({
        'SiO2':  48.68,
        'TiO2':   1.01,
        'Al2O3': 17.64,
        # 'Fe2O3':  0.0,
        'Cr2O3':  0.0425,
        'FeO':    8.0,
        'MgO':    9.10,
        'CaO':   12.45,
        'Na2O':   2.65,
        'K2O':    0.03,
        'P2O5':   0.08,
        'H2O':    0.2
        })
Set redox state (note that you can skip this if you want the FeO and Fe2O3 set in the bulk composition above):
logfO2 = ('QFM', 0.0) # Could also use NNO, IW, etc.
Find the liquidus for a single pressure#
Set the pressure and then run the calculation and print the output:
P_bar = 1000.0

sys = magmaforge.System(comp=comp_wtpt,
                        T_liquidus=True,
                        P_bar=P_bar,
                        logfO2=logfO2,
                        database=db)

print(f"The liquidus temperature at {P_bar:.1f} bar is {sys.T_C:.1f} ˚C.")
The liquidus temperature at 1000.0 bar is 1247.3 ˚C.
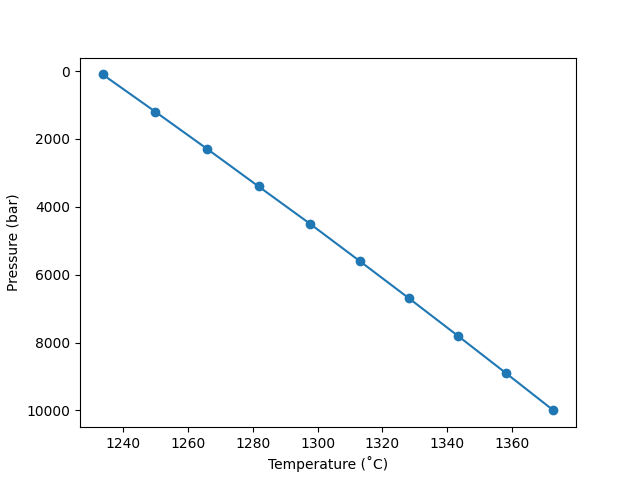
Plot the liquidus over a pressure range#
Set the minimum and maximum pressure and number of points and run calculations:
Pmin_bar = 100.0
Pmax_bar = 10000.0
n = 10

liquidus = np.zeros(n)
pressures = np.linspace(Pmin_bar, Pmax_bar, n)

for i in range(n):
    sys = magmaforge.System(comp=comp_wtpt,
                            T_liquidus=True,
                            P_bar=pressures[i],
                            logfO2=logfO2,
                            database=db)

    liquidus[i] = sys.T_C
fig, ax = plt.subplots()

ax.plot(liquidus, pressures, marker='o')
ax.invert_yaxis()
ax.set_ylabel('Pressure (bar)')
ax.set_xlabel('Temperature (˚C)')

plt.show()
Total running time of the script: (0 minutes 26.514 seconds)