Note
Go to the end to download the full example code.
MagmaForge: Isobaric mantle melting#
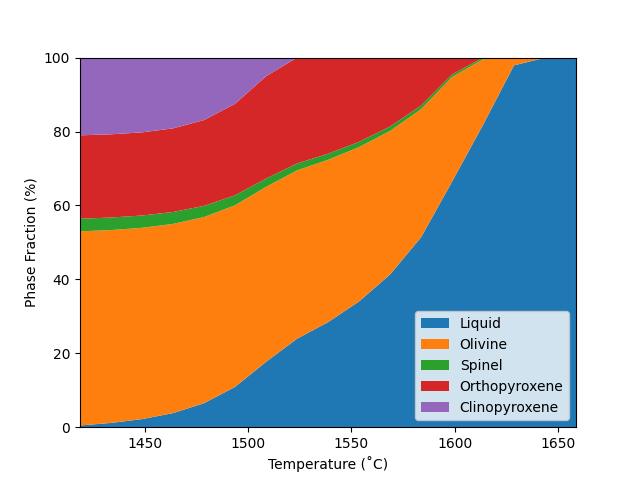
Demonstrates how to calculate the phase assemblage during mantle melting at fixed pressure using pMELTS.
Open this code in an executable MyBinder instance (MyBinder links may be slow to load– please be patient!):

Initialization#
Import necessary packages:
from thermoengine import magmaforge
import numpy as np
import matplotlib.pyplot as plt
Set up a bulk composition, here using the MM3 peridotite composition:
comp_wtpt = {
    'SiO2': 45.5,
    'TiO2': 0.11,
    'Al2O3': 3.98,
    'Fe2O3': 0.15,
    'Cr2O3': 0.68,
    'FeO': 7.18,
    'MnO': 0.0,
    'MgO': 38.53,
    'NiO': 0.0,
    'CoO': 0.0,
    'CaO': 3.59,
    'Na2O': 0.31,
    'K2O': 0.0,
    'P2O5': 0.0,
    'H2O': 0.0,
}
Run Calculations#
Set Pressure below:
sys = magmaforge.System(comp=comp_wtpt,
                        T_liquidus=True,
                        P_GPa=2.0,
                        database='MELTS_pMELTS')

sys.crystallize(method='equil',
                T_step=15.0,
                )
<thermoengine.magmaforge.system.System object at 0xffff9efa0f40>
Plot the mineral assemblage#
phs_fracs = sys.history.get_phase_frac_table(phases='present')
fig, ax = plt.subplots()

line_to_plot = np.zeros(len(phs_fracs))
line_to_plot_prev = line_to_plot.copy()
for phase in ['Liquid', 'Olivine', 'Spinel', 'Orthopyroxene',
              'Clinopyroxene', 'Garnet']:
    if phase in phs_fracs:
        line_to_plot += phs_fracs[phase]
        ax.fill_between(phs_fracs.index - 273.15,
                        line_to_plot*100,
                        line_to_plot_prev*100,
                        label=phase)

        line_to_plot_prev = line_to_plot.copy()

ax.set_xlim(sys.history.get_temperatures()[-1] - 273.15,
            sys.history.get_temperatures()[0] - 273.15)
ax.set_ylim(0,100)
ax.set_xlabel('Temperature (˚C)')
ax.set_ylabel('Phase Fraction (%)')

ax.legend()

plt.show()
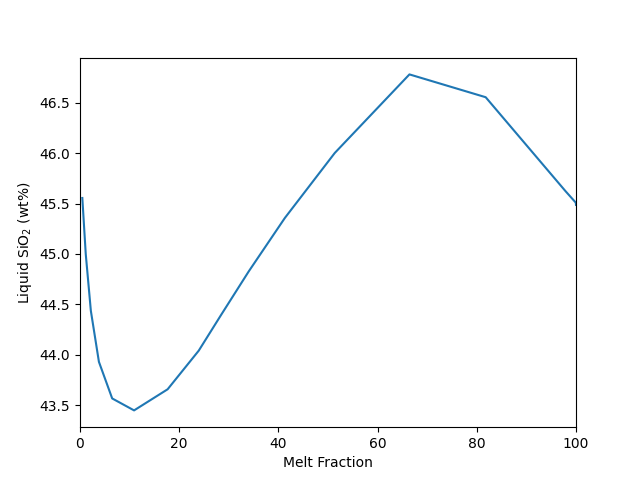
Make plots of the liquid composition#
liq_comp = sys.history.get_phase_comp_table('Liquid')

fig, ax = plt.subplots()

ax.plot(phs_fracs['Liquid']*100,
        liq_comp['SiO2']/liq_comp.sum(axis=1)*100)

ax.set_xlabel('Melt Fraction')
ax.set_ylabel("Liquid SiO$_2$ (wt%)")
ax.set_xlim(0,100)

plt.show()
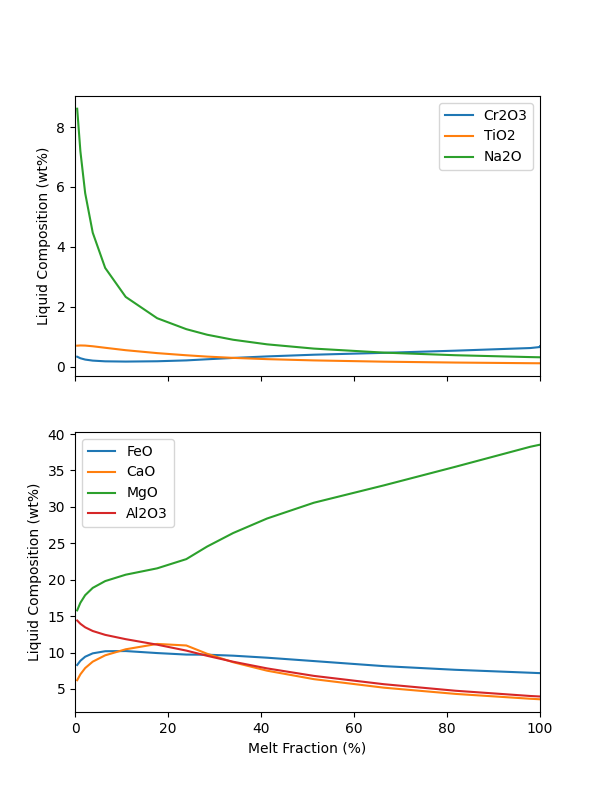
fig, ax = plt.subplots(2,1, figsize=(6,8), sharex='col')

oxides = ['Cr2O3', 'TiO2', 'Na2O']
for ox in oxides:
    ax[0].plot(phs_fracs['Liquid']*100,
               liq_comp[ox], label=ox)

ax[0].set_xlim(0, 100)
ax[0].legend()
ax[0].set_ylabel('Liquid Composition (wt%)')

oxides = ['FeO', 'CaO', 'MgO', 'Al2O3']
for i, ox in zip(range(4), oxides):
    ax[1].plot(phs_fracs['Liquid']*100,
               liq_comp[ox], label=ox)

ax[1].legend()
ax[1].set_xlabel('Melt Fraction (%)')
ax[1].set_ylabel('Liquid Composition (wt%)')


plt.show()
Total running time of the script: (0 minutes 3.397 seconds)